(Auxiliary) Tools for research
In this post I want to talk about some tools (or something like that) that are useful in the day-to-day research, but usually not so popular for being somewhat tangential to the area specific in which each one works.
Scripting
A script is a usually simple program that performs a series of tasks. If there is a task that must be done more than ... five times (the number varies according to the patience), then I think it's something we can ask the computer to do for us. In other words: we can automate that work. Some tasks that can be a good alternative to automate are: rename 100 files, convert a file from one format to another (e.g. STL to OBJ), read 387 files with information on the climate and graph its evolution temporary (minimum, maximum and average temperature). These tasks can be easy to do by hand, but for the amount of work that they involve are tedious.
The first thing to do is to get a scripting language. Some options are Python, Bash, Julia, Matlab/Octave, Scilab. Allowing myself to follow my bias, I would recommend to use Python.
Graphics and schematics
A picture is worth a thousand words, or so the saying goes. Personally, it seems absolutely true to me and I try to do scribbles to better understand something or explain it better. The first thing I would like to mention is the difference between images bitmap (or raster) and vector images.
Bitmap image: it's an image which is represented by an array (or rectangular grid) of pixels. In other words, the color information that there are in each point of the image. The most popular formats store the compressed information. For high contrast graphics (such as schematics or diagrams) the best format is PNG. If you have an animation, GIF would be preferable. And in the case of photographs it is better to use JPG.
Vector image: is an image that is made up of geometric entities. In this case, the stored information is not point-to-point but the construction of the shapes that constitute it. For this reason, these images don't pixelate because the information you have is how to build it. This type of images is the best options for schematics and diagrams, since the only stored information are the strokes and text added to them (see Figure 1). The de facto standard for this type of images is PDF —it is the one I usually include in my documents \(\LaTeX\), although there is a way to embed SVG in \(\LaTeX\) But it's something I haven't yet explored. Although PDF is the standard, the preferred format is SVG (Scalable Vector Graphics) which is a standard across the internet and most modern browsers allow viewing.
Recapping, we should use JPG images for photographs and SVG for schematics/diagrams. Another attribute that may be useful is the Layer management, SVG allows this ... and for raster formats we have the option to use TIFF.
Regarding software to generate/edit this type of images I must say that there are a large number of programs that allow exporting to these formats: Python/Matplotlib, Matlab, Inkscape, Adobe Illustrator, GIMP, Photoshop, LibreOffice. If the graph is generated from a calculation or a data series I use Matplotlib. If instead, we want to make a schematic or my tool of choice is Inkscape. This program is intended to be a free alternative to programs like Adobe Illustrator —and it does achieve it. Obviously, you could use Illustrator or Corel Draw for this task. If the only use would be to make Technical schematics, I think it would be a waste.
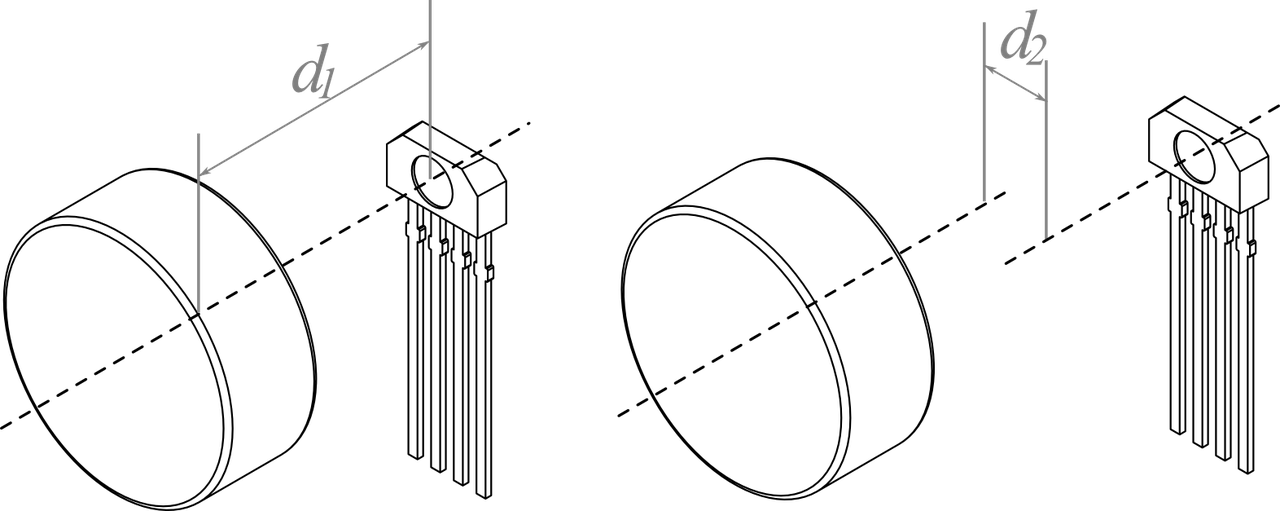 |
Figure 1. Schematic for magnetic field sensing for permanent magnets using Hall effect. From my Engineering Physics thesis . |
Taking notes
I suppose that to some it would seem a bit trivial to speak of "notetaking" and much more coming from someone who didn't have notebooks in high school, but since I'm a bit stubborn I think I'll still write a little about this. The first thing I would like to mention is that I remember people talking to me about this at school, but there was never anything formal regarding developing these skills. Surfing the web, there is a lot of information. Even the Wikipedia article on English is interesting. There is nothing better to write than to have a good pen and paper with a good grammage, that's why I still use a notebook where I keep track of what I do in my research and take notes. However, this scheme is quite linear and leaves out more contemporary options. That is, why settle for a document in this time of hyper-documents? The advantages of taking notes digitally jump to the eye, in a hyper-document you can have links, embed images, video and sound.
Regarding tools, I include a short list here:
Evernote is probably the most popular tool for taking notes. It's cross-platform, Freemium (free basic and paid advanced functionality), and has many options. I use it, but not much in my research.
Zim it is an offline wiki. Has great number of options like calendar, equations with \(\LaTeX\), images ... anyway. The but that I find is that no I have managed to configure the equations in Windows (and in my office I must use Windows :-/).
Docear this is a tool thought, mainly, to handle bibliography. However, it allows to take notes and, in general, handle the information of the investigation. The more (or less) appealing feature is that it works around mental maps.
Zotero It is also a tool to handle bibliography, although it allows to handle some note taking (at least around the bibliography).
Mendeley it is very similar to the previous one, although with more functionalities. The biggest but that I find it is that in 2013 it was bought by Elsevier.
Regarding bibliography management I would also like to mention EndNote which is the program with the longest trajectory and JabRef which is the one that I have used the longest. Some interesting references comparing bibliography handlers are:: [A] [B] [C].
Graphic reconstruction
It is common to find information presented in the form of graphics. It is also common that we want to have the numerical data of these graphs to be able to compare them with ours. To know if our measurements/simulations/methods give results similar to others presented in the literature. We could use powerful image processing software, or other more modest ones designed specifically for this purpose.
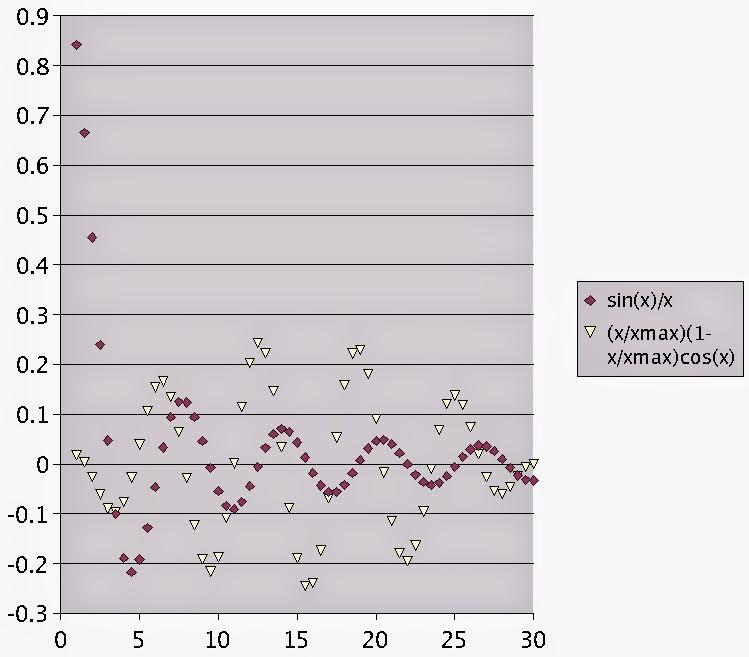 |
Figure 2. Original graphic. |
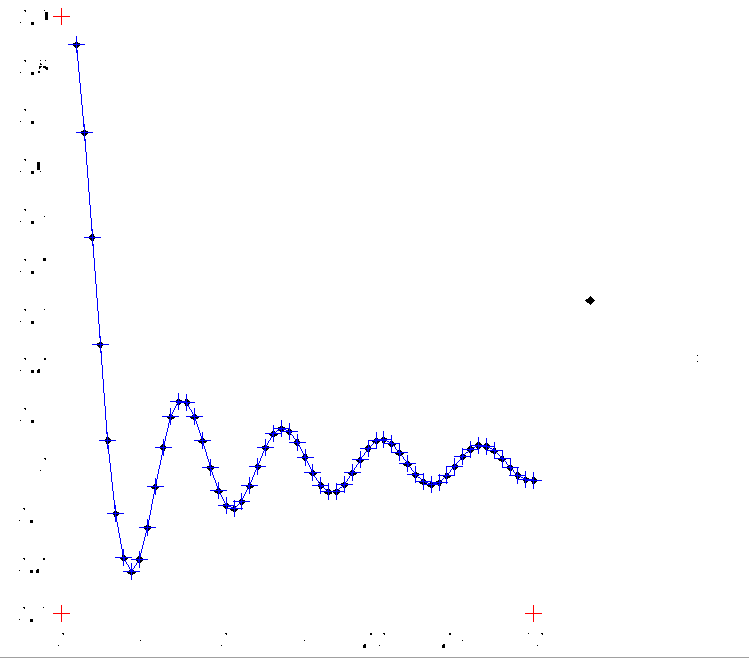 |
Figure 3. Graphic processed in Engauge Digitizer. Some points were selected (automatically) to obtain their coordinates. |
Digitizer of XY chart this is a plugin for Libreoffice/OpenOffice and it exports the result to the current spreadsheet, it is simple and easy to use.
Engauge Digitizer, is the one I normally use when I need to do this task (see Figures above). It is open source (and free) and has a fair amount of options to make the task easier.
Plot Digitizer I don't have a lot of information about this one (since I have never used it), except that it is written in Java.
ImageJ this is a (complete) program for image processing that is written in Java. I have not used it for this task on a regular basis, but could be used for it.
Scientific visualization
Scientific visualization is in charge of generating graphs that allow visualizing "scientific data" to facilitate the understanding behind the data. For this work, many of us have used scripting languages such as Matlab/Octave, Scilab or Python (with Matplotlib or Mayavi). However, as visualization is about something visual —what else?—, it is good have a tool that allows you to generate and change graphics interactively, although we must always automate as much amount of work possible (laziness has always been one of the largest mobiles of humanity, you have to accept it).
MayaVi, this is a program written in Python that uses VTK. It is very versatile and the great advantage it has is that it can be used within Python scripts.
Paraview, this program is also based on VTK and allows to parallelize the work (for multi-core computers and clusters). Below I include a video generated in Paraview to show its capabilities.
Visit, this program is also VTK based, I have never used it but I wanted to include it because people say it can be more intuitive than Paraview.
Tecplot, this program is very popular at Purdue. I think it was initially intended for CFD, but it has been much expanded. Regarding 3D graphics, it does not seem better than ParaView, however, the 2D graphics capabilities (XY graphics, and others) make it attractive.
Scavis, this is written in Java. I didn't know it until I started writing this post but it caught my eye and I wante to put it on the list. Something that cught my attention is that it allows scripting in several languages: Java, Python, Ruby, BeanShell, and Matlab/Octave.
Origin, I have never used it but I didn't want to leave it out because I've always heard great things about it (probably comparing it with Excel ... but I can't comment).
Version control
Version control is the management of changes in documents, source code and other types of information. This can be done manually, but it is easy to make mistakes or replace the version of a code easily, and for this it is advisable to use software that facilitates the work. The idea is to have a place (repository) where versions and changes are stored, and keep track of them. In this way you can revert to a previous version of documents and multiple people can work together. There are two paradigms (or architectures) for version control: centralized and distributed. In the first there is a centralized repository where you find all the information. In distributed architectures each user has a copy of the repository. Personally I have only used Git, which falls under the distributed category and is one of the most popular version contorl software at the moment; it is used by companies like Google, Facebook and Netflix.
An example can be seen in this repository, with the undergrad thesis document of Santiago Echeverri, which I had the opportunity to advise. We edited this document together while he was in Medellin and I was in USA. The document was made in the markup language \(\LaTeX\).
In addition to having control over the versions and being able to access previous versions, it is useful to be able to store the information in a accesible location from anywhere in the world with a connection to Internet. This can be achieved with your own server, obviously, or also through an external provider. Two projects that are very popular for hosting repositories are (comparison between Github and BitBucket):
Github is the most popular at the moment. It allows to have projects with an unlimited number of collaborators. To have a private repository it is necessary to pay.
BitBucket has the main advantage that allows you to have private repositories without the need to pay. It is only free for projects with 5 or fewer collaborators (or for academic projects).
Suggested links
Software Carpentry. http://software-carpentry.org/
Python Scientific Lecture Notes. https://scipy-lectures.github.io/
Surely I left a lot of topics outside as well as tools within a topic. If that's the case, I would appreciate if you tell me in the comments.
Comments
Comments powered by Disqus